
Create or Edit Existing Dashboards
How to create or edit HCM product dashboards in Kibana
Steps
Create dashboards
To understand how to create dashboards in Kibana, refer to this guide: Create a Dashboard of Panels.
Edit existing dashboards
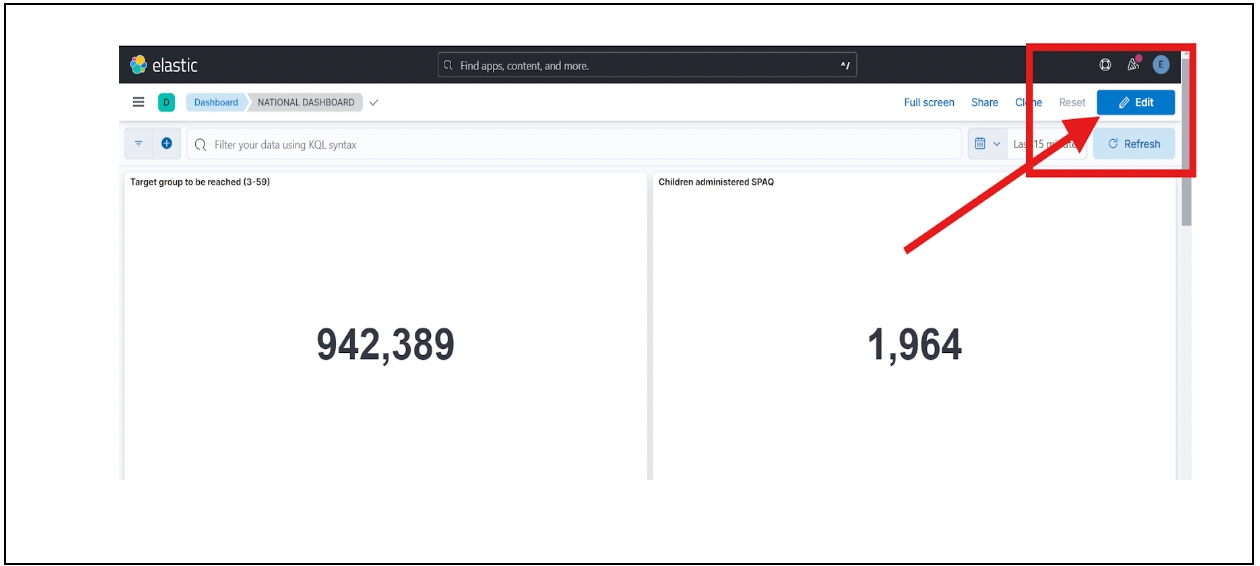
Open the desired dashboard.

Click on the 'Edit' button.
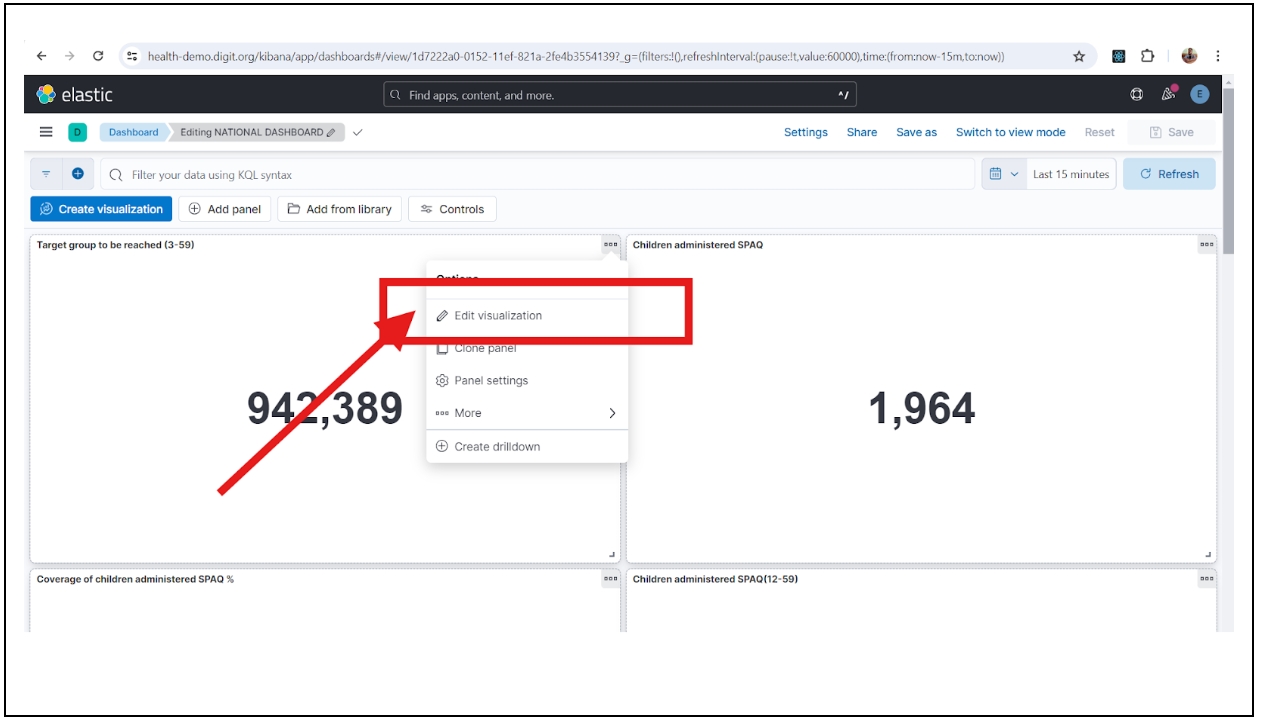
Click on the “Edit Visualisation” option on the specific chart you want to edit.
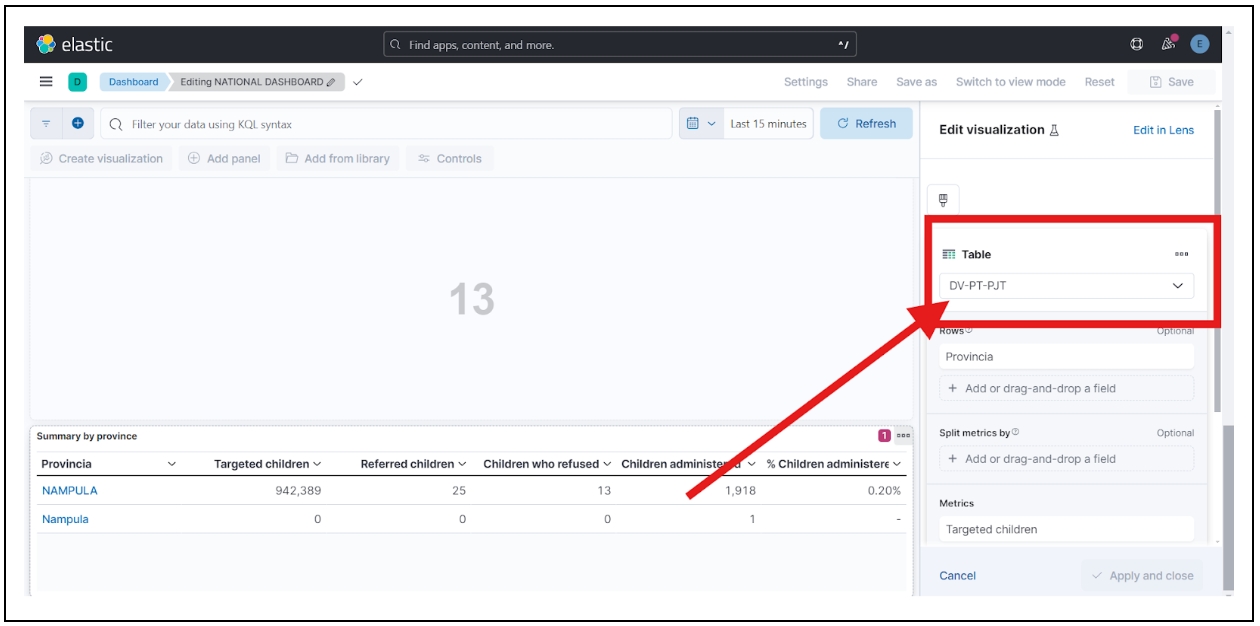
Check the chart type and data view from which the data is being fetched.
Click on “Edit Lens” to get an overview of the available and selected fields in the respective data view.
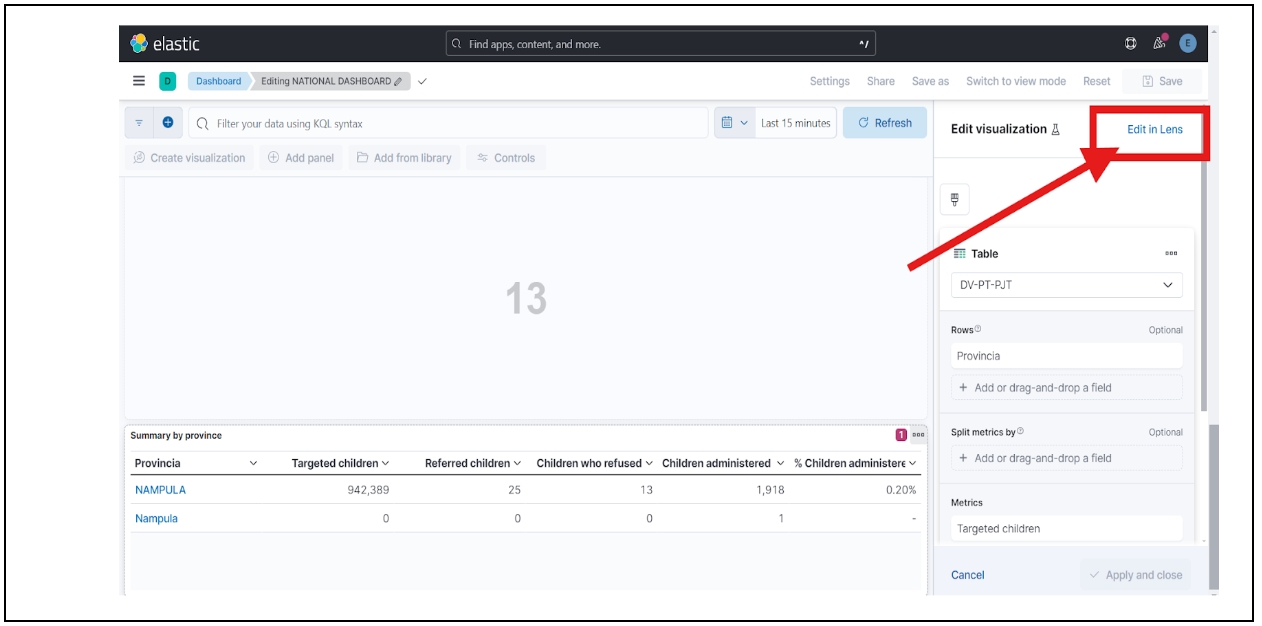
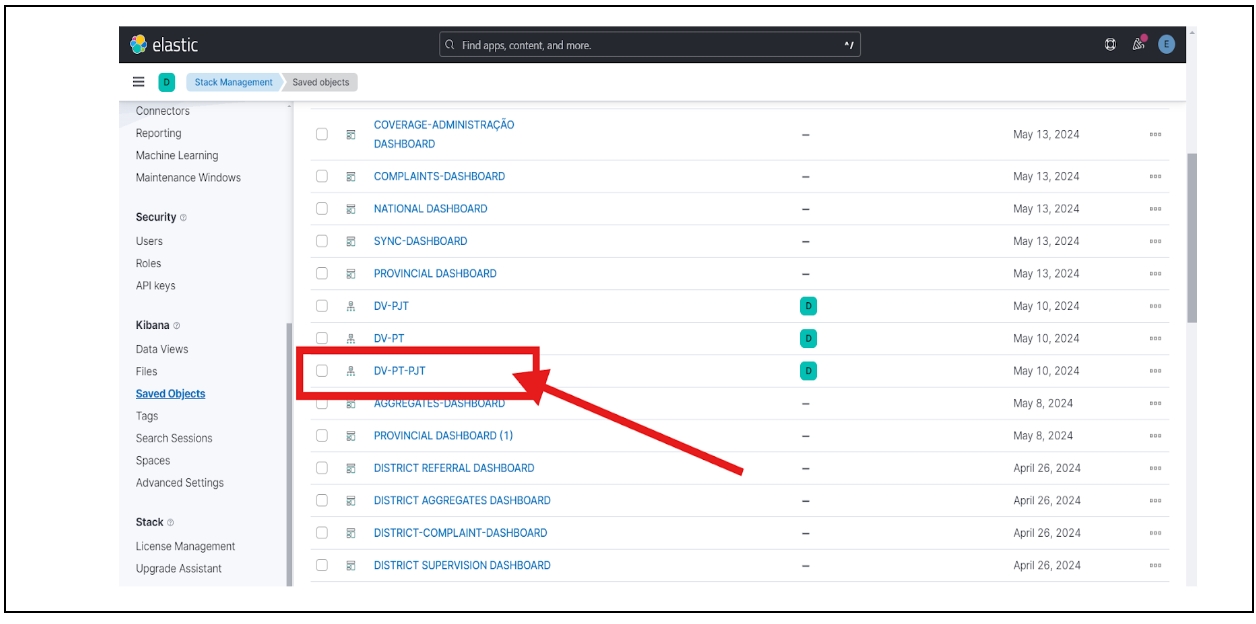
You can go to the respective data view under Stack Management -> Saved Objects, update the indexes, and add a timestamp filter for the respective chart.


View data sources
To see which index a data view is pulling the data from, check the respective data views in Stack Management -> Data Views.
If you need to create your own data views, follow this guide: Creating Data Views in Kibana.
For example, if you click on “Edit Visualisation” on a chart, you will see that the table chart is getting data from the DV-PT-PJT data view.
You can then view the DV-PT-PJT data, check the indices from where the data is getting pulled, and add a timestamp filter according to your requirements.
Last updated
Was this helpful?